CI Increases Achievement. Period.
This is part 2 of 2.
In part one, I shared an enrollment story from my prior district. This was a comparison study. We compared students who had been taught with traditional, “eclectic” methods, using the textbook as the curriculum with students who began their language learning path with a comprehension-based approach – one that attempted to maximize compelling, comprehensible input, but that did not follow a grammar scope and sequence or involve significant amounts of explicit grammar instruction or practicing speaking the language.
Percentage of students who chose to enroll into a secondary elective level 3 Spanish class was higher – in ALL subgroups – when students began their language learning path with a CI class.
But as I alluded at the end of part 1, it’s nearly impossible to limit the causal factors for the increases in enrollment in our study to the change in pedagogical approach. Student attitudes toward language learning may have been different. When I began teaching there, the program expanded to begin in 8th grade, perhaps making it more likely a ninth grader in level 2 may choose to continue because common culture is for students to take two years of languages in high school. It’s also possible that having a positive first year, regardless of pedagogical approach, may lead to increases in enrollment. All of these things – and many more – could at least partially explain away the significant increases we saw.
Remember the hypothesis:
If we teach in ways that are more brain compatible – i.e. by emphasizing comprehension first, by emphasizing and valuing interpretation of language before asking for production of language, by learning to be our students’ conversation partner, by practicing delivering compelling, comprehensible messages to their eyes and ear, by aligning instruction to principles of SLA and contemporary, communicative instruction – then more students will enjoy language class and will self-select into upper classes and more students will achieve higher rates of proficiency.
If this shift in pedagogical approach were really a more equitable approach, we would have to find additional factors to back up that assertion. We needed to test achievement.
Independent | Proficiency-based | Normed
Testing achievement is an interesting endeavor in foreign language. Most “placement exams” that I’ve seen presume students are coming from linearly taught grammar classes. Nothing like that would work. I wanted an assessment that would hopefully measure what students could actually do in the target language – something that measured their spontaneous ability. I did not want a test that was based solely on what I taught them, or in any way required that specific vocabulary had been taught. I wanted a proficiency-based, independent, normed assessment.
Commercial assessment tests were too expensive. Diana Noonan and the teachers in Denver Public Schools had not yet made their proficiency assessments available. Luckily we had access to an assessment tool through our high school dual enrollment program that in MN we call College In the Schools. This assessment is called the Minnesota Language Proficiency Assessment (MLPA).
The Minnesota Language Proficiency Assessment (MLPA) was created in the early 2000’s through a collaboration between the University of MN and the Center for Applied Research on Language Acquisition. It’s since been sold to EMC and is referred to as the ELPAC, but on CARLA’s webpage dedicated to the MLPA you can still read about it.
What is it:
This online test battery measures language learners’ proficiency in reading, writing, speaking, and listening at two intermediate levels on the American Council on the Teaching of Foreign Languages
It’s purpose is to help teachers articulate expectations and to certify proficiency.
The MLPA were developed to determine that students have attained minimal proficiency in a second language. The assessments have been used to certify that students have met designated levels of language proficiency, and facilitate the process of articulating expectations of student performance at the end of secondary studies and the beginning of post-secondary studies.
Articulating Expectations
The minimal proficiency level of Intermediate-Low level on the scale developed by the American Council on Teaching of Foreign Languages (ACTFL) was selected by members of the Minnesota Articulation Project as a reasonable benchmark for:
- students completing their secondary studies and entering college;
- students completing one year of language study at the college level.
Meeting College Language Requirements
The reading, listening, and writing assessments are also available at a higher level selected by faculty members at the University of Minnesota as the goal for proficiency at the end of two years of language study. Though this language goal was designed to be equivalent to two years of post-secondary language study, the assessments were created to ensure that students were able to demonstrate their ability to use the language of study at the appropriate level instead of just putting in the proper amount of “seat-time.”
Among the features of MLPA highlighted by CARLA are included the following:
- The MLPA include performance-based assessments that measure second language proficiency along a scale derived from the ACTFL Proficiency Guidelines;
- Tasks are authentic, contextualized, and varied;
- Reliability coefficients from data collected to date are all in the acceptable range;
- Items and tasks have been extensively field tested and refined;
- The assessments may be administered as a battery, or institutions may choose to administer one or more modalities in depending on their needs to measure learner outcomes;
- The MLPA are easy to administer to large groups as well as to individuals;
- Passing cut scores on all assessments can be calibrated to individual institutions’ needs.
The MLPA was the instrument that had been used to test students in upper levels who were in the dual-enrollment College In the Schools. It also served, for a time, as the placement assessment for incoming U of MN students. As mentioned on CARLA’s website and cited above, the Intermediate Low version of the test was thought to be an adequate benchmark for “students completing their secondary studies and entering college”.
Our school district owned a copy of this assessment and I confirmed with CARLA via email that we could use it to test lower levels with the purpose of articulating our program and measuring growth over time.
With free, easy and appropriate test in hand, I worked with our department co-chairs on a plan to pilot the assessment with level 1 students.
Comprehension Precedes Production
Comprehension precedes production. It’s a common mantra for those who embrace CI. Comprehensible input is the one underlying common denominator to language acquisition. My Dept co-chairs and I reasoned that if CI leads to acquisition, it would first become obvious in what students were able to understand. Student comprehension would precede student production. That lead us to the choice of using the listening assessment of the MLPA, the CoLA, or the Contextualized Listening Assessment, for the level 1 common assessment.
Here’s a description of the CoLA, available from the EMC webpage:
The CoLA is a 35-item assessment in which test-takers listen to mini-dialogues organized around a story line and respond to multiple-choice questions. The characters in the story engage in a variety of real-life interactions appropriate for assessing proficiency at the Intermediate-Low and Intermediate-High levels. Each situation is contextualized through the use of photographs and advance organizers. The CoLA are available online for French, German, and Spanish.
CARLA and U of MN had determined a cutoff score for their purposes and had identified a score of 22 of 35 as adequate for passing at Intermediate Low. We didn’t really know what to expect, so we extrapolated backward and identified cutoff scores that we felt would be appropriate for end of level 1, end of level 2 and end of level 3. Each of these classes meets daily for 53 minutes over the full school year. Those scores were:
- Level 1 expected range: 12-15
- Level 2 expected range: 16-21
- Level 3 expected range: 22+
This seemed reasonable as the 12 -15 range was slightly better than a statistical guess. Our cutoff scores were just guesses. Our plan was to administer it, analyze the data and see if our target scores were actually good targets. Over time we would adjust the cutoff scores accordingly. For the purposes of the pilot, we really didn’t know what to expect.
The Pilot
In spring 2012 we gave it a go. All students tested were in level 1 Spanish. They were either in 8th grade or 9th grade. They had approximately 250 minutes of instruction per week for the school year.
We tested a total of 356 students. 121 students were in my level 1 CI/TPRS class. 235 were in classes taught with what can be described as traditional, “eclectic” methods adhering to a textbook and grammatical scope and sequence.
The results were interesting, to say the least.
Results for “Traditional”
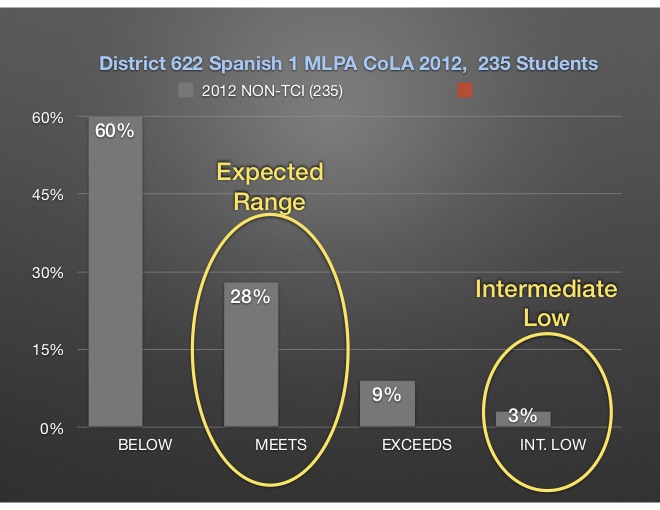
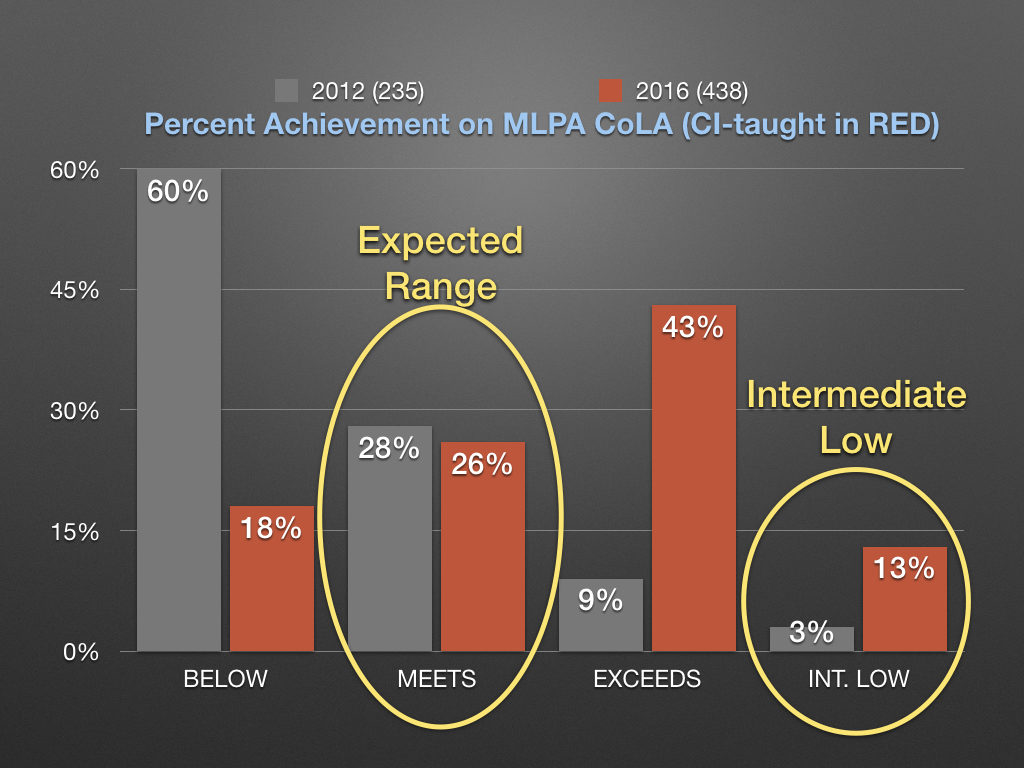
60% of students scored lower than our predicted cutoff of 12.
28% of the 235 students scored between a 12-15.
9% scored slightly beyond the expected range.
3% scored at 22 or higher, effectively reaching Intermediate Low in listening comprehension.
The 3% of students who scored 22 or higher were likely heritage Spanish speakers. We did not collect names or student IDs of students tested in 2012 and can therefore not say definitively one way or the other. But our heritage language class had not yet been approved and it was fairly common practice for heritage learners to not be removed from level 1 classes.
Not much analysis is needed for these results. Clearly either our cutoff was too high or our achievement was too low, with 88% of students scoring a 15 or lower.
Results for My CI/TPRS Taught Class
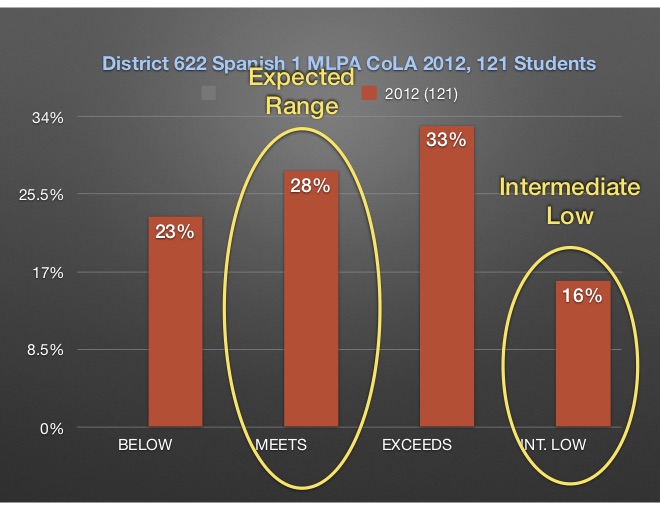
23% of students scored lower than our predicted cutoff of 12.
28% of the 121 students scored between a 12-15.
33% scored in the range we had anticipated for at the end of level 2.
16% scored at 22 or higher, effectively reaching Intermediate Low in listening comprehension.
28% of my students in this sample of 121 students scored in the expected range between 12-15. This is exactly the percentage from the other classes. But unlike those taught in traditional “eclectic” classes, only 23% of my students scored below the expected range while a total of 49% scored above the expected range.
I’ll note here that we do not have any significant descriptors of the students who took the test, other than that they were in level 1 Spanish. For this pilot data, we are missing important information that could help make the results more compelling, such as gender, ethnicity. We could compare scores to their state standardized reading scores to explore reasons for the big gap in performance.
Also, I can’t speak to how much or little the target language was used in any of the classes. My suspicion is that I used much more understandable, communicative Spanish, but I can’t prove that. In 2014 I did begin administering an end of year survey that asked for student perceptions of my practice and in 2014 98% of my students did report that I spoke Spanish “most of the time” or “almost all the time”. But that’s 2014.
At any rate, when you put the two data sets next to one another, it’s striking.
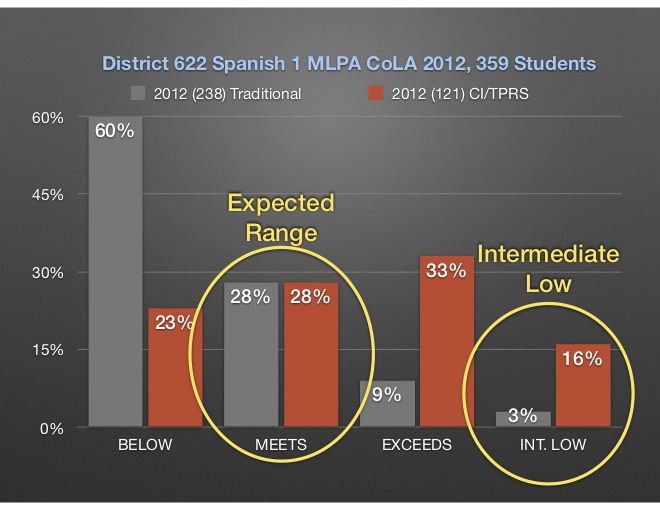
These results were, simply put, stunning. They surprised the heck out of me. In 2012 I had been using TPRS for about 5 years, but only really 3 years exclusively. And my colleagues were hard working, dedicated, creative teachers doing the absolute best job they knew how to do.
Truth be told, I hadn’t even seen what the test looked like until the day before I administered it. I sat down after school and did the test myself. I was shocked, scared and convinced my kids would bomb it.
I’m completely serious about that. The Spanish version includes three teenagers going through what might be considered a typical day. They have conversations, discuss future plans, visit a restaurant, plan a party, etc. One speaks with a Castilian accent. He acts as an exchange student living with a Mexican family. But ironically, while the brother in the Mexican family has a distinct Mexican accent, the sister speaks with an accent suggestive of Uruguay or Argentina. It wasn’t easy for me. I honestly thought my kids would have a rough time.
What I found most interesting about these results was this: In class I was seeing success and confidence in the eyes of students who, in the past, would never have been successful in my classes. I was seeing more students of varied backgrounds engaging at higher levels and learning more. These results suggested that there wasn’t much of a bell curve – more students achieved at higher rates. The bell is flattened.
Coming to Terms With Reality
My co-chairs and I took the results to our district leadership. We talked about ACTFL standards and language use position statements. We discussed language acquisition versus language learning and shared the 21st Century Skills Map for World Languages. We discussed how languages, while not required for graduation in the district, effectively became an invisible gate to competitive and private colleges. Students who take only two years of language limit themselves to state universities and schools that don’t have rigorous entrance requirements.
This achievement data, at the very least, demonstrated that it was possible for students to achieve higher than we were accustomed to them achieving. It showed that something that was happening in my classes was having a significant impact on their achievement. It’s not insignificant that these were your general level 1 students representative of the school’s student body, not a group of more selective level 3 students with behaviorally-challenged students already having been shown the door.
Plus, as we saw with the enrollment data I showed in my previous post, typical enrollment into upper levels was terrible. The district language program was falling short of providing equal opportunity to our students of diverse backgrounds and here was a potential response. We needed to realize something was not working, acknowledge that we had a role in creating the inequity, decide it was not OK and move to change our practice to improve outcomes.
Achievement, Not Personalities
In January, 2013 the administrators announced that we would be moving toward Teaching with Comprehensible Input as our pedagogical approach. Our timeline would respect those who might be most resistant to change – 10 years. Sparking a change like this did ruffle feathers. But our focus on enrollment and achievement helped us as professionals get past the pitfall we so often fall into. It’s not about personalities, it’s about the data.
We produced two key documents that would guide us in our transition. We drafted and approved a guiding goal statement for the department that referenced ACTFL’s Target Language Use position statement. It also specified our goal was communication in the target language with the understanding that ALL students should learn a second or third language. Additionally, we would define TCI in terms of four essential practices:
- Use of natural language (past, present, future tenses) from day 1
- Use of target language 90%+ from day 1
- Use of high frequency language as the core vocabulary
- High amounts of interesting, comprehensible reading at all levels.
It was my hope that these essential practices would form the backbone of professional development over the coming years. I could talk in depth about the next several years, but that’s not really the focus of this piece. I’ll just say that for the most part, we engaged in fairly deliberate and targeted professional development in CI/TPRS. We transitioned from a grammar scope and sequence to one built on novels and high frequency language. Some people jumped on board eagerly, others came along kicking and screaming. But over time, as you’ll see, we shifted.
A Common Assessment
As is the current fad, our district asked us to implement common assessments. We made many good-hearted efforts at creating common assessments that were based, initially, on content of a textbook. Later we evolved as we continued to move toward teaching for acquisition and proficiency. We got away from tests on discrete vocabulary and moved toward testing for what students could understand and produce. But all in all, the effort allocated to this process was tedious and contentious. Everyone had a better idea that the other person. Nobody wanted to put in the extra time and effort to create something beyond the outline. Grading these was a tedious process. There was no time allocated for us to get together to view, compare and discuss results. The process and system were flawed and I believed that the MLPA could resolve this.
The plan called for each teacher to administer the MLPA at the end of each year for each class. Our goal was not to determine if every teacher was teaching the same content. It was not to determine if every student was learning the same words. Our stated goal was to measure growth over time – to ensure that our students were becoming more and more proficient as the seat time increased. In accordance with the mantra that comprehension precedes production, we vertically planned the testing accordingly:
- Level 1: Contextualized Listening Assessment (CoLA)
- Level 2: CoLA and the Contextualized Reading Assessment (CoRA)
- Level 3: CoLA + CoRA + Writing
- Level 4: CoLA + CoRA + Writing + Speaking
Despite the mandate from the district curriculum leader, we still did not have the support or the leadership needed to make the MLPA data collection easy or consistent. Some teachers chose not to administer it and faced no consequences. Those who did were unsure what to do with the data, who to turn it in to, etc. I was not in a leadership role, so I continued to collect my own and analyze my own data.
Results Over 5 Years
My students’ results in 2012 were so different than the results from other teachers. I thought it had to be a fluke. I continued to collect data from my own classes over the next several years. The data indicated to me that the initial results from 2012 were not an anomaly.
Yeah, But You’re a Teacher of the Year
Clearly, something about the instruction I was providing was different. I tried sharing results. I wanted people to know that CI/TPRS was working. I wanted to be challenged by tough questions about my process and approach. I wanted to be able to seek an independent assessment of whether what I was seeing was actually special.
I reached out administrators and district leaders. I reached out to those who created the test at the U of MN. I spoke with a couple different people at the organization, but none seemed terribly interested in learning more or collaborating in any way. I reached out to the person at the state department of education and I also reached out to ACTFL, who put me in touch with Meg Malone, ACTFL’s assessment director.
The common refrain I heard from most of the academics I spoke with was, “Yeah, but you’re a Teacher of the Year. You’re just an exceptional teacher.”
It’s true that I’ve received accolades for my teaching, something that many more teachers deserve even more than I. But writing off the success of my students on this independent assessment felt wrong. 10 years ago my students would have gotten the results mirrored in the traditionally taught classes. I had seen problems with my results, sought out and tried different approaches, read and learned, failed and tried again and failed again. I was and still am under the impression that the response should not have been about the person, but about the strategies, techniques and approaches that are leading to the results.
It was discouraging to continually hear that the results were due to me being an exceptional teacher, rather than interest in or curiosity about what I was doing differently in my classes. The underlying message I got from some was that the average teacher would never be able to get these scores and I fundamentally disagree. And here’s why:
A New Assessment Guru
In September 2015 we got a new assessment guru in the district. We were able to make a plan for simple collection of student MLPA scores via Infinite Campus. That would finally allow us to also disaggregate the data to look at performance by gender, ethnicity and socio-economic data via free/reduced lunch status.
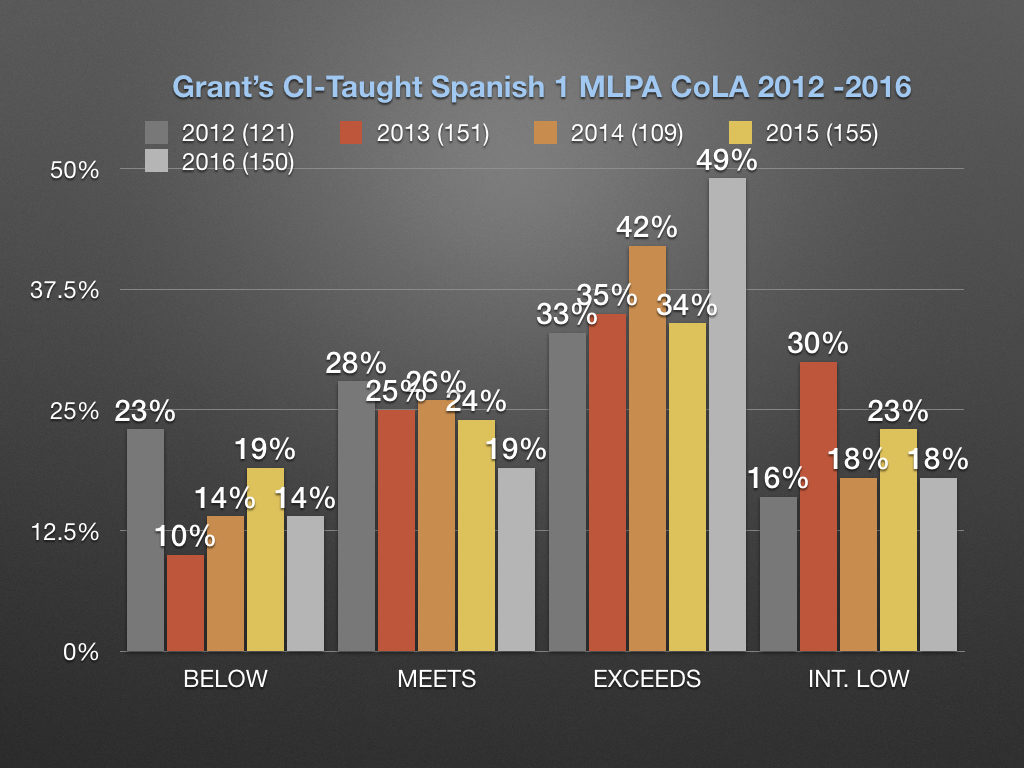
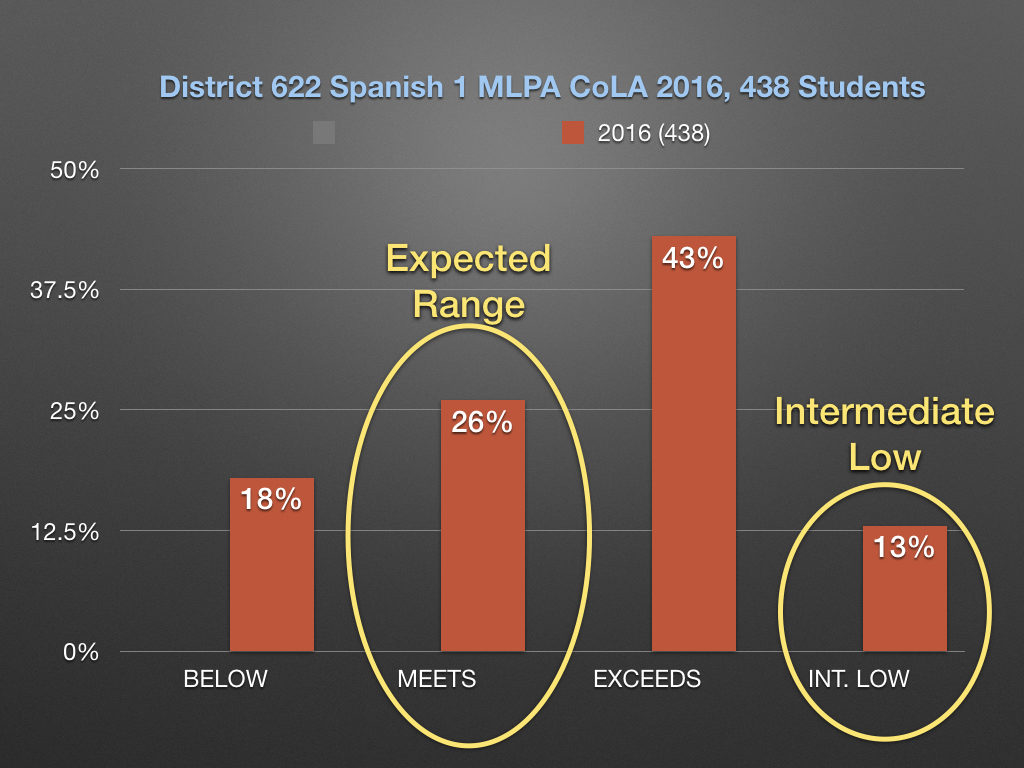
This was the fourth year after our district leaders had officially called for a change to the instructional model. We had had some training which usually had come in the form of a 1 day presentation. Some had attended iFLT, which in the summer of 2015 was hosted at our own high school. At the end of the 2016 school year, here is what the MLPA CoLA data looked like across all buildings for Spanish Level 1 students:
Now let’s lay that over the initial data from 2012:
So here you have a team of teachers – some very invested and some less so – improving their craft (again with varying degrees of dedication) and implementing more comprehension-based strategies and techniques over the span of a few years. The results overall now mirror the results I was getting in my own classes. If the academics I spoke to are correct, these teachers all deserve the Teacher of the Year award. While that is true, I believe what this really shows is that an early focus on comprehension and interaction using strategies and techniques being developed and refined by practitioners of TPRS and CI-based approaches in the early years drives achievement up. WAY up for many students.
But is it Equitable?
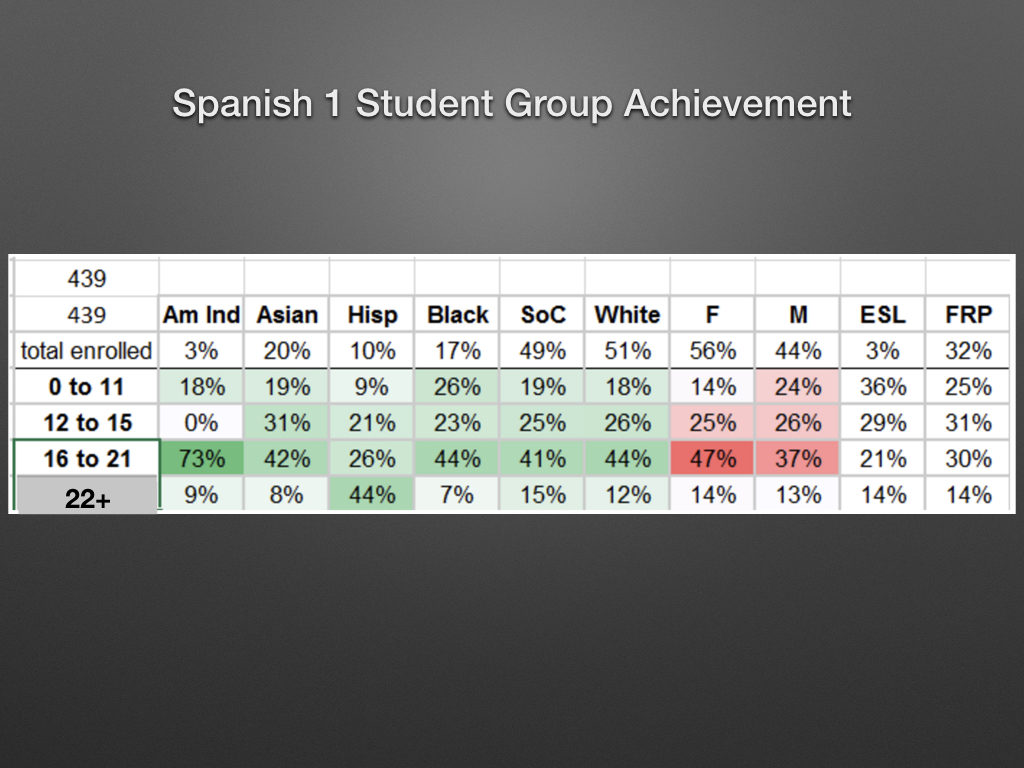
Last chart I’ll share on this post is an analysis of the data broken down by subgroups:
There is a lot of information even in this small chart. I’m just going to highlight a couple things by subgroup:
By Gender
Males and females generally performed on par with one another in each of the four groups with
- 25% of males and 26% of females scoring in the 12-15 or Expected range
- 14% of males and 13% of females scoring in the 22+ or Intermediate Low range
By Ethnicity
Students of Color is used in the district to refer to all non-white students. When comparing white students to Students of Color, there is not a significant discrepancy between performance at the various levels. Even when you look at individual ethnicities, there are only a couple areas that appear to be real outliers. Generally speaking, there is pretty equitable representation of different subgroups throughout the four scoring ranges.
By Socio-Economic Status
Of the students who receive free or reduced lunch, 25% performed below the expected range, 31% performed within the expected range and a total of 44% performed beyond the expected range. I haven’t compared that to the standardized math assessment, but I’d bet we don’t see 44% of students in poverty exceeding standards on it. In fact, I’d put my paycheck on the table.
Conclusion
Is CI/TPRS the “only” way? Probably not, but in the context of a standard secondary educational setting it deserves consideration. Over the period of a few years, the teachers in our department have focused on our own practice. We have learned about language acquisition being the result of comprehensible input. We have learned that speaking comes as a result of acquisition, rather than it being the cause. We have adjusted curriculum to be more about the students in the room, rather than the page of the book they’re on. We have learned that one proficiency-based assessment at the end of the year can tell us more than many content-specific assessments throughout the year. Weighing the pig more often doesn’t make the bacon taste better. We have learned that without a significant shift in student demographics, a focus on our own practice has resulted in a huge difference in results.
So there it is. And here is your call to action. If you could significantly increase the achievement of your students and the enrollment into upper levels, what would it take to get you to try new strategies and to open your mind to different ideas? If you could teach in a way that allows equal access to language acquisition for each of your students regardless of ethnicity, gender or socio-economic status, would you? Would you fight for it in your department? I would. And I did. And a lot of kids have had better experiences in their language classes as a result.
Happy language acquisition everyone. See you at iFLT in Cincinnati and the Ignite conference in Oklahoma this summer.

Thank you for sharing this. The data speaks volumes.
Grant, the results are what I would expect because we know. Your collection and analysis of the data is stunning. I am so grateful for this and will be sharing on our Latin Best Practices list.
It was hard for this retired teacher to dig into this and read it all the way through, imagining too vividly as I did so all the thought and time spent trying to clearly demonstrate the obvious to those who could not see it. But it was so compelling that I could read it all.
Your work speaks to me with special depth for its background in ‘mindset’ and the destructive nature of comparative praise–how calling you ‘exceptional’ let other people refuse to see your sheer hard work, mired within fixed mindsets and self-limiting beliefs. I suspect that the experience was torture for you, behind the public mask of appreciation that you had to wear.
Thank you Grant for this awesome post and compilation of data. It speaks volume and hopefully will bring faith and enthusiasm to teachers who may still be skeptic.
See you at iFLT!
Hi there! I really enjoyed this post, and appreciate your use of data. I’m just curious – your title is very interesting. What, exactly, are your burying? Is it the “traditional” methods? Using a textbook in order? Grammar and vocabulary focus? Or is it something else? I would say that I am focused on input as well, and do not follow a “traditional” grammar scope and sequence, and I do not do much with explicit grammar. I too am in favor of providing input and CI to students – and may use a variety of strategies to do so, with TPRS being one of those strategies. I am not solely a “TPRS” teacher. The strategies I use do not involve a textbook, but also incorporate authentic resources. I do aim to make the TL comprehensible to students at all times, and employ a variety of techniques to do so. Thank you again for a well-written post. I think that, although I am not completely a TPRS teacher, I am on the side of acquisition as well. Looking forward to your thoughts. Thank you for your time.
Hi Amanda, Sounds to me like you and I approach things in a similar fashion. I am not on the #authres bandwagon. That’s because I teach level 1 and 2 and I believe I get a bigger bang for the buck with co-created texts or texts that are written expressly for students at the level they’re at. But, that’s a bigger topic to tackle. I believe if you’re embracing the notion that comprehension precedes production, that lang. acq. is the result of ci, not of language practice and you’re filtering the experiences and interactions you engage in with your students through that filter first, then you’re definitely a CI teacher. I do use TPRS a lot and the fundamental strategies and techniques that good TPRS teachers use no matter how I’m engaging my students. Thanks for posting!!
Pingback:The Research Supporting the Comprehensible Input Hypothesis and C.I. Instruction | t.p.r.s. q&a
Great article and fantastic data. I know this works from my own practice, but can’t always find the right words to explain it to my colleagues. This article will help. Thanks!
Pingback:Retaining Students in Language Programs - Kid World Citizen
Pingback:#MyFives: Blog posts I recommend from 2018 - The Comprehensible Classroom
Pingback:But They Can’t Conjugate Verbs! | t.p.r.s. q&a
Pingback:#MyFives Top 5 Posts of 2018 - SRTA Spanish